Learning better representations for clustering
Clustering is a form of unsupervised learning, aims at grouping dataset exhibiting similar characteristics. For example, in finance where customers demonstrating default behavior would often be grouped in a cluster. Another example, given a set of images which consist of dogs, cat, bird when passed through a clustering algorithm should be able to create individual clusters; one each for dog, cat and bird.
One of the ways to achieve a task of clustering, is to represent each observation using a feature vector followed with a standard kmeans algorithm. The task of Kmeans for clustering becomes much more easier if feature vector/n-dimensional representation for each observations are well represented. Reserach article published at ICLR 2019 1 combines the two; representational learning and clustering using autoencoder and self organizing map.
A partial overview of their approach is illustrated in figure below which trains the model in an end to end fashion using weighted sum of four loss components (Loss1, Loss2, Loss3, Loss4)
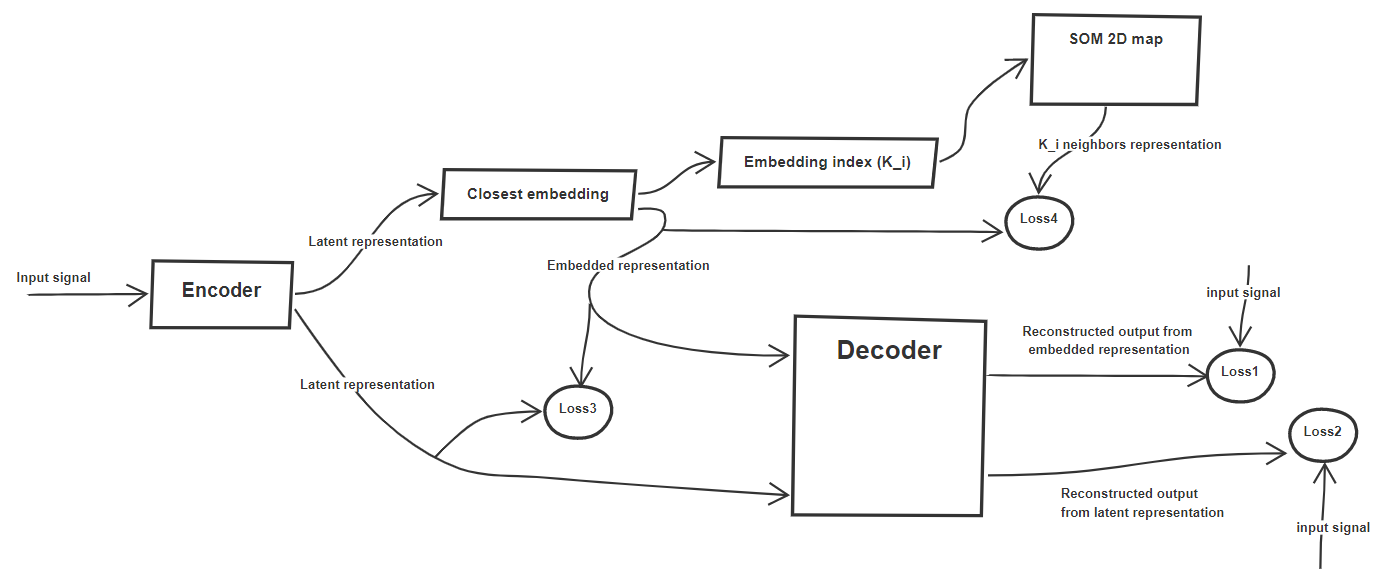
Loss1 and 2 are also known as reconstruction loss corresponding to encoded representation and embedded representation. The authors initialize the embedded representations for a pre-defined number of clusters (K_i). Thus for a given encoded representation its closest embedded representation is identified threby assigning each latent/encoded representation to a cluster (K_i). To enforce the similarity of encoded representation to its assigned embedded representation Loss3 is incorporated. Loss4 ensures that the neighbors of K_i to be closer to encoded representation, this enables embeddings to exhibit self organizing property.
Experimental observation
S&P 500 dataset for 500 industries is taken from 2. For the purpose of this blog, I took open price data for each industry aggregated at a monthly level available from Feb-13 to Feb-18. Monthly open price movement is first standardized using z-scaler.
Using above defined architecture, the model is trained to minimize the weighted sum of losses (1-4).
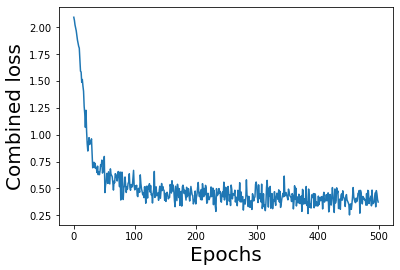
For the purpose of model training the entire length of S&P 500 time series values (aggregated at monthly level) is fed as an input to the encoder (which is MLP network). The loss function behavior is depicted below:
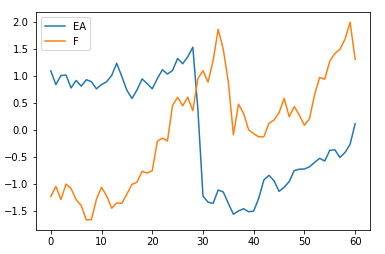
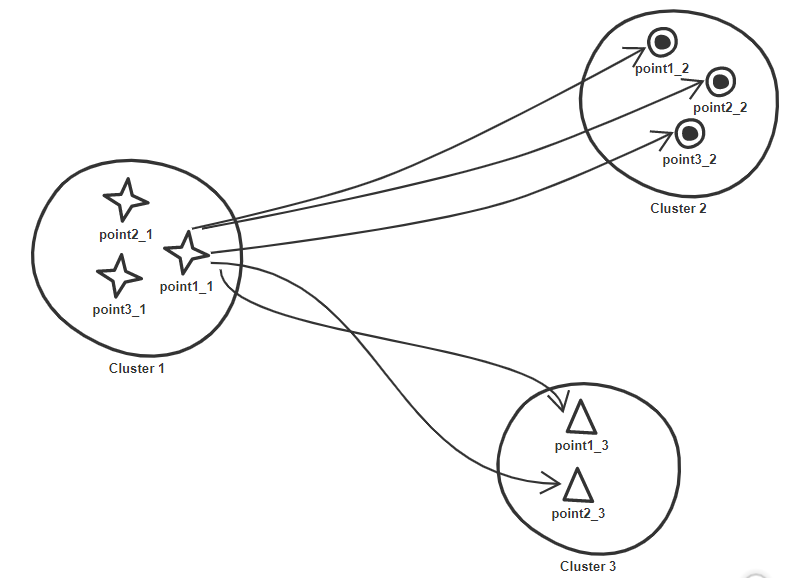
Now lets look at the time series data falling into the same cluster. For this distance between pair of points falling into same cluster is identified and the pair possesing the minimum distance is picked for illustration purpose.
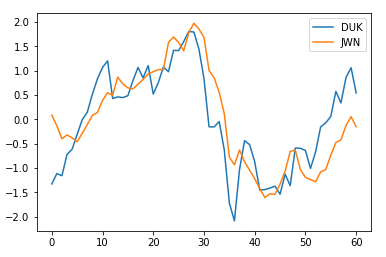
When a pair with maximum distance is picked within the same cluster, the two time series follow the same trend except scale difference.
Overall clustering performance
Since labels are not present to evaluate how well the time series signals are clustered, a combination of pairwise point distance within the cluster and in between cluster is used. Corresponding to each point its average pairwise distance within its own cluster is derived and average pairwise distance to points falling in each cluster other than its own. This gives an estimate of how far a point is from its own cluster in comparison to each of the remaining cluster individually.
Thus for a point say Point1_1 we end up having three distance measures; one is referred as within obtained by taking average of pairwise point distance in its own cluster (Point1_1, Point2_1), (Point1_1, Point3_1). Remaining two would be estimated by taking average of point1_1 distance to points falling in cluster 2 and 3 individually.
This will be repeated for all the points across all the clusters. In an ideal situation where points are clustered appropriately within distance measure for a point should be less than its distance to other clusters. Thus, we derive a ratio of a point distance to its own cluster (referred here as within) with average of distances to remaining cluster.
The closeness of ratio to zero indicates the better clustering quality. Below we plot the histogram of ratio across all the points.
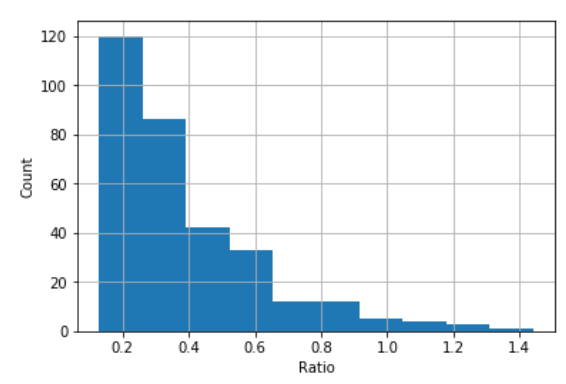
In histogram above, there are few points whose ratio is greater than depicting they are not clustered correctly as their distance to its own cluster is higher than remaining cluster.
What I really liked ?
The method proposed in this paper 1 offers an end to end approach; right from learning representation to assigning clusters. However a challenge still remains to choose the appropriate cluster counts which could cluster points such that their within distance is always lesser than the average distance to remaining clusters.
The codebase is adapted from the one released by author and is slightly modified to remove the effect of loss occuring due to transition probabilities and only consider losses (L1-L4) defined above. Another direction in which the effectiveness of algorithm could be tested is by replacing MLP at the autoencoder with LSTM to retain the time varying behavior of time series data
Drawings are made using 3